National Overview and Spatial Distribution
Canada’s 2025 wildfire season will be remembered as a turning point in the nation’s relationship with fire. Across 5,508 fires, flames consumed 8.82 million hectares of forest, grassland, and tundra, making this the second-worst fire season in Canadian history (Natural Resources Canada). To comprehend this scale, the burned area exceeds the combined land mass of New Brunswick, Nova Scotia, and Prince Edward Island. It is larger than the entire country of Austria, which spans 83,879 square kilometers. If the burned territory were a province, it would rank as Canada’s fifth largest by area.
The 2025 season burned 2.16 times the ten-year average of 4.08 million hectares, representing a 116 percent increase over typical fire years. Yet the number of fires, at 5,508, was only 3 percent above the ten-year average of 5,347 fires (Canadian Interagency Forest Fire Centre). This reveals the defining characteristic of 2025: fires did not occur more frequently, but each fire burned dramatically larger. The average fire size in 2025 was 1,600 hectares per fire, more than double the ten-year average of 763 hectares per fire. Canada was not experiencing more ignitions, but rather a fundamental shift in fire behavior once ignitions occurred. The season peaked in late May through August, with fire activity spreading across nearly every province and territory. Saskatchewan and Manitoba bore the brunt of destruction, together accounting for 57.5 percent of all burned territory despite representing only 16.6 percent of fire occurrences.
This concentration of impact in the prairie provinces created a regional crisis that required mobilization of national and international firefighting resources on an unprecedented scale. The spatial distribution of these fires reveals distinct geographic patterns driven by climate anomalies, fuel conditions, and landscape characteristics. While fires occurred from coast to coast, they were not evenly distributed. Some regions experienced catastrophic fire seasons while others saw near-normal or even below-normal activity. Examining the spatial data provides insights into how climate patterns, fuel availability, ignition sources, and fire management capacity interact to shape Canada’s evolving fire regime.

The fire occurrence map in Figure 1 displays the location of every fire centroid across Canada in 2025. This map reveals the geographic fingerprint of the season. The densest concentration of fire starts appears in a continuous band stretching from northern Saskatchewan through Manitoba and into Ontario, creating what can be described as Canada’s 2025 fire corridor. This band represents the boreal-prairie transition zone where coniferous forests meet grasslands, creating continuous fuel loads that allowed fires to spread rapidly once ignited. The clustering of fire centroids in this region reflects both the climate conditions that prevailed through spring and summer, particularly persistent high pressure systems that dried fuels to dangerous levels, and the landscape configuration that enabled fire propagation.
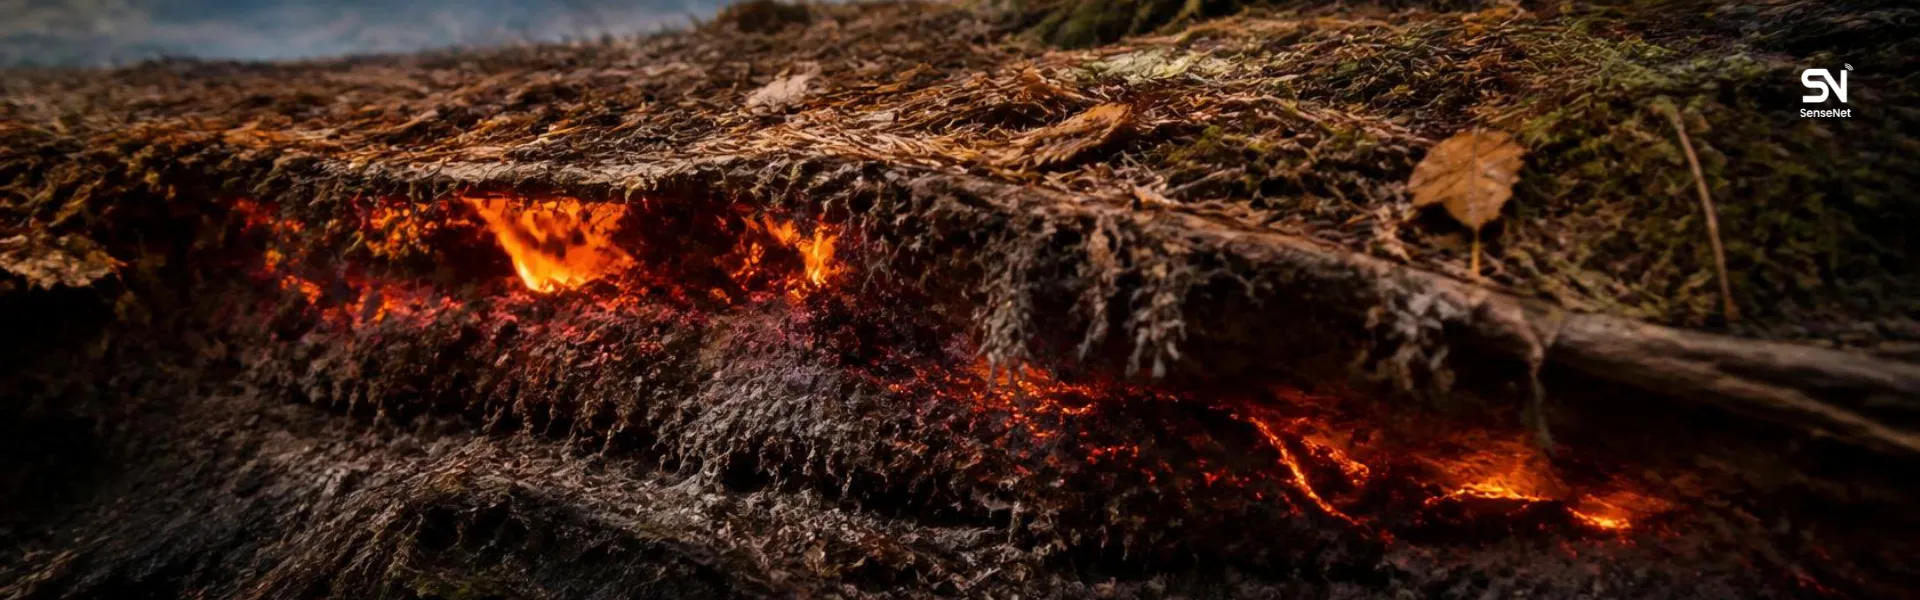
British Columbia shows a different pattern in Figure 1. Fire centroids cluster heavily in the central interior, particularly in the Prince George Fire Centre region. This concentration indicates that BC’s fire activity was not distributed across the province but focused in specific geographic zones where fuel moisture, weather, and ignition sources aligned. The clustering also reflects the continuation of fire activity from previous seasons, including the zombie fires that survived winter and reignited in spring 2025. Northern territories including Yukon and Northwest Territories display scattered fire centroids across vast geographic areas. The isolation of these points reflects the remote nature of northern fire activity, where fires often burn in wilderness areas far from populated communities. Atlantic Canada shows small but significant clusters of fire centroids in Nova Scotia and New Brunswick, marking the unprecedented appearance of fire in regions that have historically been considered immune to large-scale wildfire due to maritime climate influences.
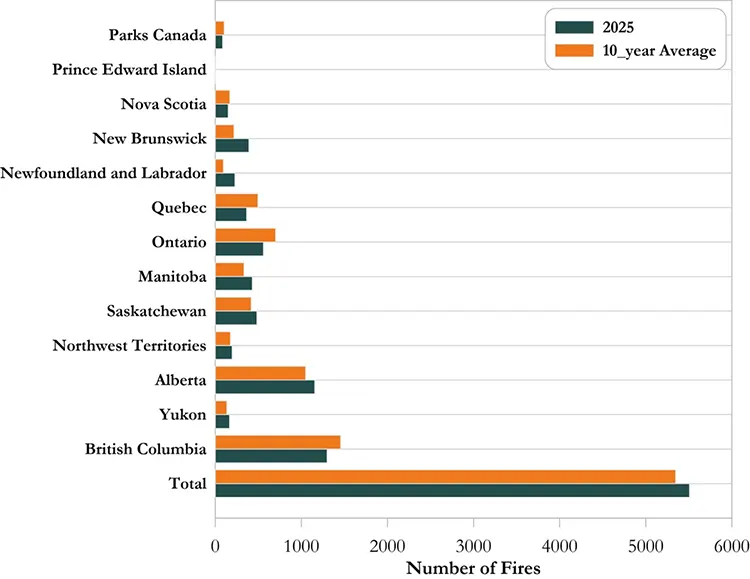
Figure 2 presents the horizontal bar charts quantifying fire occurrences by province and comparing 2025 to the ten-year average. British Columbia leads the nation with 1,299 fires, representing 23.6 percent of Canada’s total fire occurrences. However, this represents a decrease from BC’s ten-year average of 1,456 fires, making 2025 an 89 percent year for BC fire occurrence. Alberta recorded 1,155 fires (21.0 percent of national total), a 10 percent increase over its average of 1,049 fires. Saskatchewan reported 484 fires (8.8 percent of national total), 16 percent above its ten-year average of 417 fires. Manitoba recorded 430 fires (7.8 percent), representing a 29 percent increase over the average of 333 fires. Ontario recorded 560 fires (10.2 percent of national total), though this was 20 percent below its ten-year average of 701 fires. The Atlantic provinces showed dramatic increases in fire occurrence (Canadian Wildland Fire Information System).
Newfoundland and Labrador recorded 229 fires compared to a ten-year average of only 94 fires, representing a 144 percent increase. New Brunswick recorded 391 fires versus an average of 216, an 81 percent increase. These statistics confirm that while total national fire occurrence was near average, the distribution shifted dramatically, with prairie provinces and Atlantic Canada experiencing elevated fire starts while traditional fire-prone regions like Ontario saw below-average occurrence.
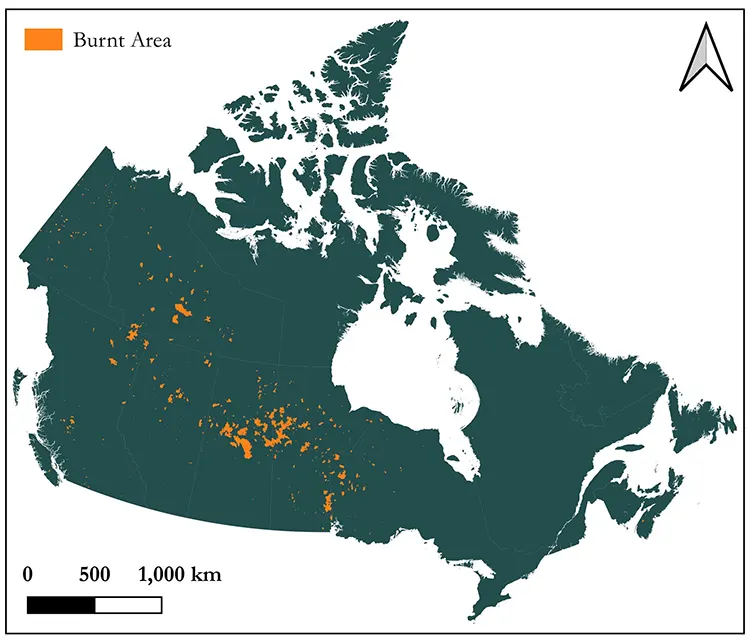
The burnt area map in Figure 3 displays the actual spatial footprint of fire damage across Canada, revealing the true geographic impact of the 2025 season. This satellite-derived map shows the boundaries of burned areas as orange polygons overlaid on Canada’s geography. The contrast between fire occurrence shown in Figure 1 and burnt area shown in Figure 3 is striking and instructive. Large continuous orange polygons dominate Saskatchewan and Manitoba, with some individual fire scars spanning hundreds of thousands of hectares. These massive contiguous burnt areas reflect prairie fire behavior where fires spread rapidly across expansive boreal forests and grasslands with continuous fuel loads and limited natural fire breaks. The largest burns appear in northern Saskatchewan and central Manitoba, regions where fuel accumulation over decades combined with extreme drought conditions in 2025 created explosive fire potential.
In contrast, British Columbia shows smaller, more scattered burnt area patches distributed across the central interior. While BC had numerous fire starts (Figure 1 and Figure 2), the resulting burn scars are more fragmented, suggesting that fires encountered fuel discontinuities, topographic barriers, or effective suppression that prevented individual fires from growing to prairie-scale dimensions. Alberta shows a similar pattern to BC, with moderate-sized burn scars distributed across the northern and central regions. The Northwest Territories display large isolated burn scars in remote northern regions, reflecting fires that grew to enormous sizes due to delayed detection and limited suppression resources in wilderness areas. The eastern provinces show minimal burnt area polygons. Quebec, despite recording 364 fires, shows almost no visible burn scars on the national map, indicating that fire suppression efforts successfully contained fires before they grew to significant size. Atlantic Canada shows small but unprecedented burnt area patches in Nova Scotia and New Brunswick, historically fire-resistant regions where maritime climate has traditionally prevented large fire growth.
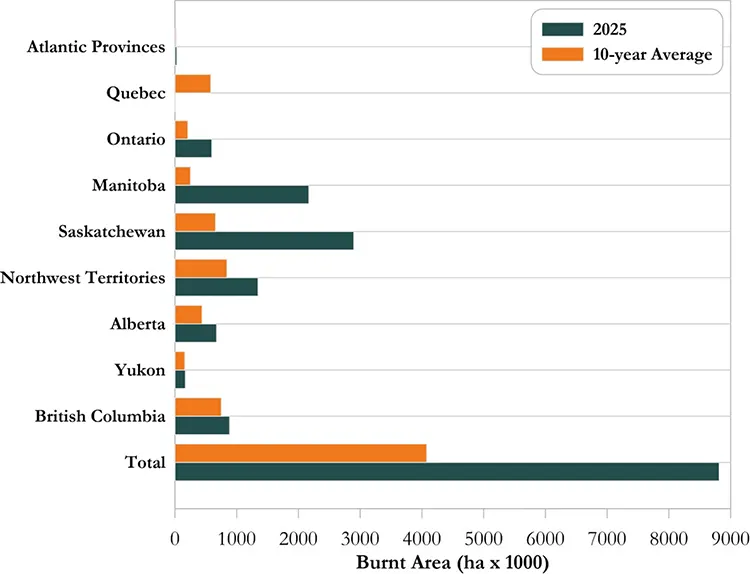
Figure 4 presents horizontal bar charts comparing area burnt by province in 2025 versus the ten-year average, and this chart reveals the true severity and geographic concentration of the 2025 season. Saskatchewan’s 2025 bar extends to 2,896 thousand hectares, dramatically beyond its ten-year average of 657 thousand hectares. This represents a ratio of 4.41, meaning Saskatchewan burned 4.41 times its typical annual area. Manitoba shows an even more extreme deviation, burning 2,169 thousand hectares in 2025 compared to a ten-year average of only 251 thousand hectares, a ratio of 8.64 (Canadian Wildland Fire Information System). Manitoba’s 2025 season was nearly nine times worse than an average year, the most extreme deviation of any province. Ontario burned 598 thousand hectares versus an average of 208 thousand hectares, a 2.88 ratio. Northwest Territories burned 1,346 thousand hectares compared to 842 thousand hectares average, a 1.60 ratio. Alberta burned 675 thousand hectares versus 439 thousand hectares average, a 1.54 ratio. British Columbia burned 886 thousand hectares compared to 751 thousand hectares average, a modest 1.18 ratio, indicating a near-normal year by BC standards.
Quebec presents a startling anomaly, burning only 6.5 thousand hectares in 2025 compared to a ten-year average of 579 thousand hectares. This represents a ratio of 0.01, meaning Quebec burned only 1 percent of its typical area. The 2025 season in Quebec was one of the mildest on record, a dramatic contrast to the catastrophic conditions in adjacent provinces. Quebec’s anomalously mild 2025 fire season resulted from meteorological conditions that diverged sharply from the extreme patterns driving catastrophic burning elsewhere. While the prairie provinces experienced persistent high-pressure systems that suppressed precipitation and elevated temperatures, Quebec remained under more frequent Atlantic cyclonic systems that delivered above-average precipitation during critical fire season months. Fuel moisture content remained substantially elevated relative to the ten-year average, creating conditions incompatible with rapid fire propagation. Fine fuel moisture codes stayed consistently below critical thresholds throughout the season, preventing the fire intensity amplification that occurred across the prairies. The 2025 season thus represents a temporary atmospheric anomaly that produced markedly different hydroclimate conditions across Quebec compared to the drought-dominated conditions defining the broader continental fire crisis (SOPFEU).
The provincial share charts in Figure 5 present pie charts that quantify each province’s contribution to national fire occurrence and area burned, providing the clearest summary of geographic concentration. In the fire occurrence pie chart, British Columbia claims the largest slice at 24 percent of all Canadian fires, followed by Alberta at 21 percent, Ontario at 10 percent, Saskatchewan at 9 percent, Manitoba at 8 percent, and Quebec at 7 percent. The area burned pie chart tells a dramatically different story.
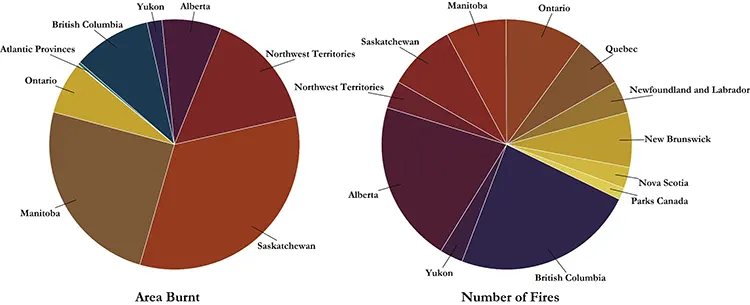
Saskatchewan claims 33 percent of total area burned despite generating only 9 percent of fires. Manitoba accounts for 25 percent of area burned from only 8 percent of fires. Northwest Territories burned 15 percent of national area from only 4 percent of fires. British Columbia burned 10 percent of area from 24 percent of fires. Alberta burned 8 percent of area from 21 percent of fires. These comparisons reveal that average fire size varied dramatically by region. Saskatchewan fires averaged 5,984 hectares per fire compared to a ten-year average of 1,575 hectares, a nearly fourfold increase in fire size. Manitoba fires averaged 5,044 hectares compared to 754 hectares historically, a sevenfold increase.
In contrast, British Columbia fires averaged only 682 hectares, slightly above its historical average of 516 hectares. Quebec fires averaged only 18 hectares per fire in 2025, compared to 1,170 hectares historically, indicating that fires were detected and suppressed in their initial stages throughout Quebec. Together, Saskatchewan and Manitoba combined burned 5,065 thousand hectares, representing 57.5 percent of Canada’s total burned area from only 16.6 percent of fire occurrences. This concentration of impact transforms the 2025 season from a national crisis into a regional catastrophe centered on the prairie provinces. The implications are profound. Fire management resources, evacuations, smoke impacts, economic costs, and ecological damage were not distributed evenly across Canada but concentrated in a geographic band where climate conditions, fuel loads, and fire behavior aligned to create unprecedented destruction (Canadian Wildland Fire Information System).
The spatial analysis reveals that 2025 was a tale of two Canadas: the prairie provinces experiencing apocalyptic fire seasons that exceeded historical experience by factors of four to nine, while other regions experienced relatively normal or even mild fire years. This geographic concentration challenges national approaches to fire management and suggests that future resource allocation must account for the emerging reality of region-specific fire regimes driven by localized climate patterns rather than uniform national trends.
Canada 2025 Fire Season Analysis
- Canada 2025 Fire Season Part 1: Second largest in the past 40 years
- Canada 2025 Fire Season Part 2: The Prairie Epicenter, Saskatchewan and Manitoba
- Canada 2025 Fire Season Part 3: Western Focus, Alberta, British Columbia, and the Northwest Territories
- Canada 2025 Fire Season Part 4: Seasonal Dynamics and 10-Year Comparison
- Canada 2025 Fire Season Part 5: Response Operations and Resource Mobilization
- Canada 2025 Fire Season Part 6: Long-Term Trends and Historical Context