Response Operations and Resource Mobilization
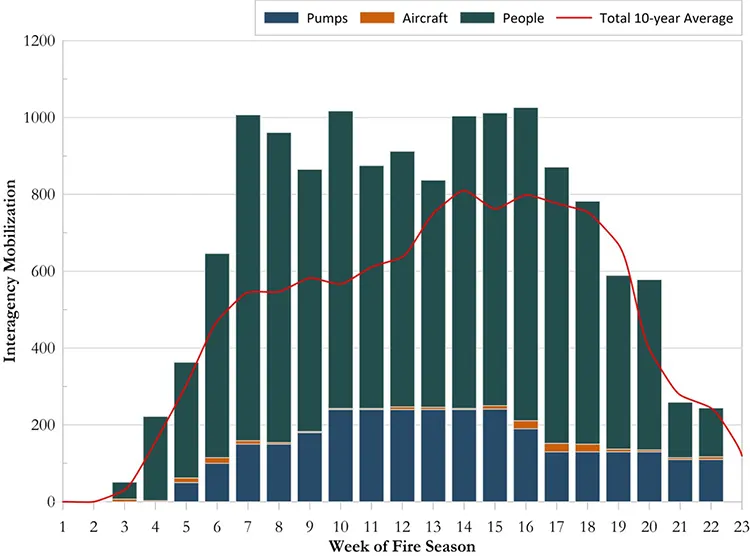
Canada’s response to the 2025 wildfire crisis required unprecedented coordination of firefighting resources across jurisdictions and international borders. Figure 12 and Figure 13 demonstrate the scale of mobilization: total personnel-weeks reached 10,950 compared to a ten-year average of 10,809, essentially equal despite 2.18 times more area burned. This reveals that firefighting resources were allocated more intensively but not substantially increased, suggesting 2025’s mitigation relied primarily on better coordination of existing resources rather than expanded capacity (Canadian Wildland Fire Information System).
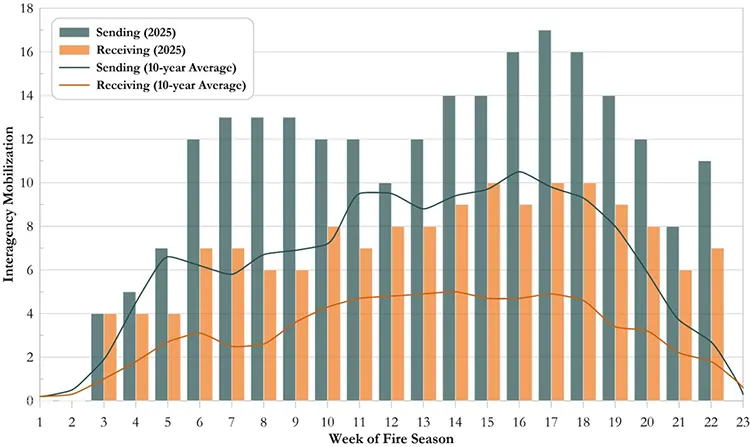
When fires exploded across Saskatchewan and Manitoba in late May, provincial fire services immediately deployed all available resources, but fire intensity quickly exceeded domestic capacity. Provinces activated mutual aid agreements within days. Figure 13 shows weeks 5-8 (late May through mid-June) with agencies receiving resources at 6-7 per week, 2 to 2.3 times the historical average of 2.6 to 3.1 agencies. This indicates Saskatchewan and Manitoba received resources from Ontario, Quebec, BC, Alberta, and other provinces, demonstrating the national scope of the crisis.
Early season response in weeks 5-8 mobilized 2,487 person-weeks compared to 1,866 person-weeks average, a 1.33 times increase. Week 7 peaked at 848 personnel, 1.55 times average. Figure 12 shows this surge corresponded exactly with the catastrophic area burned peak. Equipment mobilization differed from personnel patterns. Pumps ramped from 50 in week 5 to 240-241 during weeks 10-16, totaling 3,001 pump-weeks seasonally. Aircraft peaked later in weeks 16-18 at 20-22 per week, demonstrating how resources shifted geographically as the crisis moved from prairies to western provinces.
Figure 13 shows total interagency interactions reached 235 sending and 147 receiving events, compared to historical averages of 144 and 72 respectively. Sending increased 1.64 times while receiving increased 2.05 times. This asymmetry reflects jurisdictions receiving resources multiple times as new fires escalated their emergencies. Provinces continuously rebalanced resources: Ontario sent to Manitoba in week 6, then received from Quebec in week 10 when Ontario’s fires intensified. This sophisticated system worked but revealed fragility: more geographically distributed fires could have overwhelmed capacity.
Mid-season (weeks 9-16) showed resource mobilization shift westward. As prairie fires stabilized, BC and Alberta began receiving resources as their fire activity intensified in July and early August. Northwest Territories received resources as unprecedented northern fire activity stretched capacity. Late season (weeks 17-20) maintained high mobilization with peak sending at 16-17 agencies and receiving at 9-10 agencies, reflecting sustained burning in BC and NWT requiring continued aerial operations and ground support.
International cooperation proved critical. By July, international firefighters arrived in significant numbers. The United States mobilized approximately 20 crews, 5 complex incident management teams, and 214 overhead personnel. Chile, Costa Rica, Mexico, and other Latin American nations sent firefighters, recognizing that their spring fire seasons did not overlap with North American summer peaks, enabling mutual aid during off-season periods.
The plateau in personnel deployment reveals a fundamental constraint. Figure 12 shows personnel declining to 1.0 times average by mid-season despite continued high fire activity. Personnel bars in weeks 9-16 remained at 600-800 per week but not dramatically exceeding historical patterns, suggesting Canada reached near-maximum sustainable firefighting capacity. Trained firefighters number in the thousands nationally; mobilizing most creates risks for undefended regions elsewhere. Pumps and aircraft remained available at higher levels, indicating equipment deployment could scale where personnel could not, but pumps require trained operators, creating a bottleneck.
By week 22, resource levels normalized as fires declined naturally with temperature cooling and increased rainfall. The 2025 response demonstrated that Canadian fire management institutions can mobilize extraordinary resources when activated fully. However, sustained high mobilization for 16 weeks (weeks 5-20) reveals a system operating at maximum capacity, unable to substantially increase resources despite 2.18 times more area burned than average.
Canada 2025 Fire Season Analysis
- Canada 2025 Fire Season Part 1: Second largest in the past 40 years
- Canada 2025 Fire Season Part 2: The Prairie Epicenter, Saskatchewan and Manitoba
- Canada 2025 Fire Season Part 3: Western Focus, Alberta, British Columbia, and the Northwest Territories
- Canada 2025 Fire Season Part 4: Seasonal Dynamics and 10-Year Comparison
- Canada 2025 Fire Season Part 5: Response Operations and Resource Mobilization
- Canada 2025 Fire Season Part 6: Long-Term Trends and Historical Context