Seasonal Dynamics and 10-Year Comparison
The 2025 fire season told a story in three acts. An opening in late May and early June brought devastation. Sustained chaos followed through summer. A gradual fade arrived in fall. Understanding this temporal progression reveals how weather, fuel dryness, and fire behavior shifted throughout the season, creating periods of explosive expansion and brief calm.
May began quietly. Fires kindled across the prairies at measured pace, matching historical averages. Then came May 31, a turning point that changed everything. By month’s end, 1.48 million hectares had burned. Saskatchewan had consumed 563 thousand hectares, Manitoba 462 thousand hectares, and Alberta 279 thousand hectares. In a single month, before June even arrived, Canada had burned one-sixth of its entire annual total (Canadian Wildland Fire Information System).
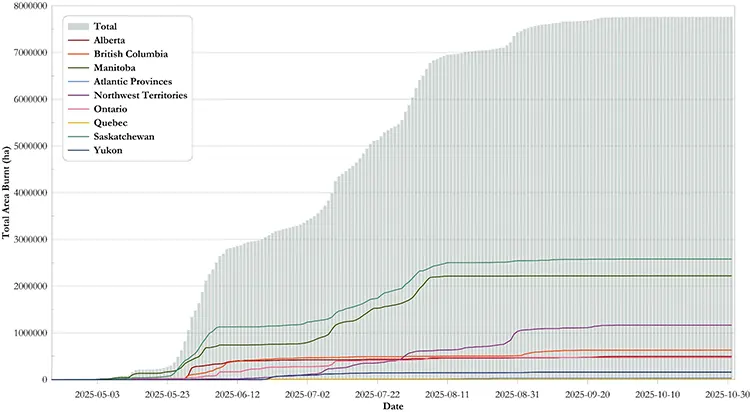
Figure 9 captures this moment with dramatic clarity. Saskatchewan’s line sits flat through May, then explodes upward from May 26 onward, rising from 563 to 1.13 million hectares in three weeks. Manitoba follows the same trajectory, rising from 462 to 742 thousand hectares by mid-June before plateauing. By June 15, just 47 days into the season, the nation had burned 2.94 million hectares, representing one-third of the entire year’s burning. Daily burn rates exceeded 100 thousand hectares during peak weeks. After mid-June, cumulative lines continued upward but with gentler slope, signaling a shift from catastrophic to merely severe burning.
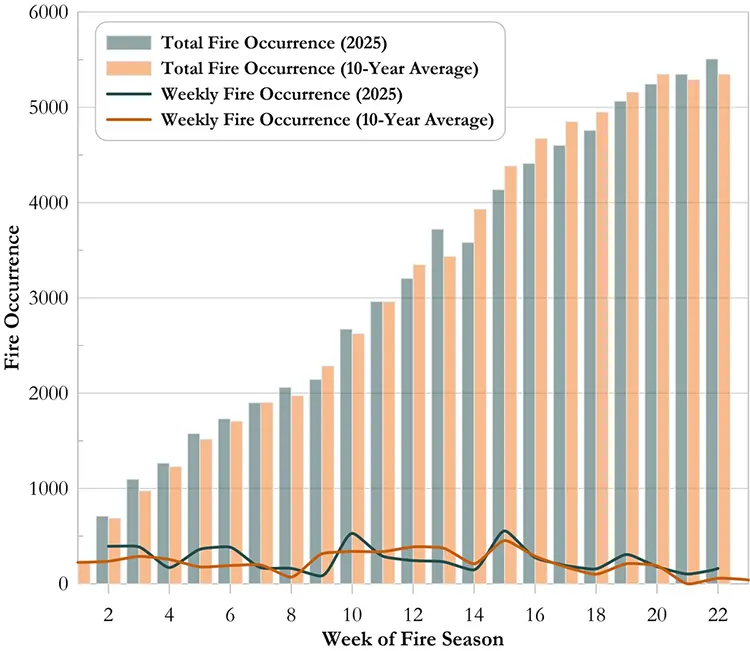
Figure 10 reveals the central paradox of 2025. Fire counts remained nearly normal throughout the season. Week 15 saw 554 fires versus 453 average (1.22 times). Week 10 recorded 528 fires versus 339 average (1.56 times). Week 6 recorded 383 fires versus 191 average (2.01 times). By season’s end, total fire occurrence was 5,470 fires versus 5,108 average, representing merely 1.07 times or just 7 percent above normal. Fire occurrence stayed essentially flat.
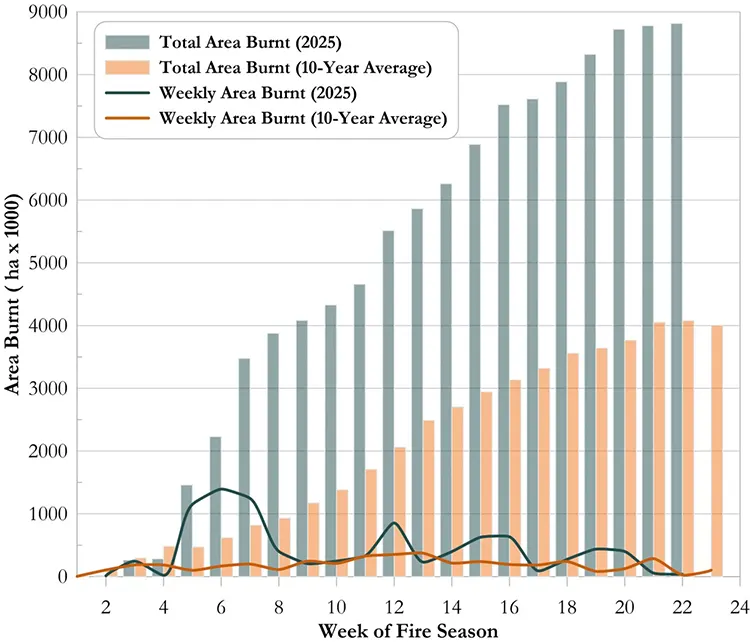
Yet Figure 11 tells a completely different story. Area burned doubled at 2.18 times average while fire occurrence remained near normal. The defining characteristic emerges immediately: not more fires, but fires burning catastrophically larger. Average fire size nearly doubled from 763 hectares historically to 1,600 hectares in 2025. Four catastrophic weeks stand out in Figure 11. Week 5 burned 1.15 million hectares at 11.5 times average. Week 6 burned 1.39 million hectares at 8.3 times average. Week 7 burned 1.25 million hectares at 6.3 times average. Week 8 burned 401 thousand hectares at 3.6 times average. These four weeks burned 4.47 million hectares, representing 48 percent of the entire season’s total. By June 22, the 2025 cumulative reached 4.47 million hectares while historical average reached only 1.06 million hectares, a 4.23 times deviation. Canada had already burned more than four times the typical half-year fire load (Canadian Wildland Fire Information System).
Week 12 showed another spike at 853 thousand hectares (2.4 times average), and weeks 15 to 16 at 627 and 634 thousand hectares (2.6 to 3.3 times average). These secondary peaks corresponded to a mid-summer lightning storm from July 30 to August 1 that produced over 35,000 strikes across British Columbia in 48 hours, igniting 65 new fires. One unusual late-season exception appeared in week 19 from September 1 to 7, which burned 438 thousand hectares at 5.3 times average, representing fires that had smoldered for weeks before finally exploding.
The seasonal breakdown reveals profound temporal concentration. Early season (weeks 1-8) burned 4.47 million hectares versus 1.06 million average, a 4.23 times increase representing 48.1 percent of total burning. Mid-season (weeks 9-16) burned 3.52 million hectares versus 2.15 million average (1.64 times increase), representing 37.9 percent. Late season (weeks 17-23) burned 1.29 million hectares versus 1.05 million average (1.24 times increase), representing 13.9 percent.
Half the season’s fire damage occurred in the first third of the fire season. By mid-August, nearly 90 percent of the year’s total burning was complete. This compressed temporal pattern exhausted firefighting resources during May and June. International firefighters arriving in July found the crisis already past its peak. The typical September decline arrived on schedule as temperatures cooled and moisture returned.
The fundamental characteristic becomes clear. Fire occurrence was nearly normal at 1.07 times average. Area burned was more than double at 2.18 times average. The message is unambiguous. 2025 was defined not by more ignitions but by larger fires burning with unprecedented intensity and spread.
The geographic pattern in Figure 9 shows how provinces contributed to different phases. Saskatchewan and Manitoba dominated May and June with extreme burning before stabilizing. Alberta peaked early then eased. British Columbia and Northwest Territories showed sustained burning throughout the entire season, with NWT burning continuously from May through October. This geographic variation explains why response efforts shifted repeatedly throughout the season, moving from prairie provinces in spring to western regions in summer.
Canada 2025 Fire Season Analysis
- Canada 2025 Fire Season Part 1: Second largest in the past 40 years
- Canada 2025 Fire Season Part 2: The Prairie Epicenter, Saskatchewan and Manitoba
- Canada 2025 Fire Season Part 3: Western Focus, Alberta, British Columbia, and the Northwest Territories
- Canada 2025 Fire Season Part 4: Seasonal Dynamics and 10-Year Comparison
- Canada 2025 Fire Season Part 5: Response Operations and Resource Mobilization
- Canada 2025 Fire Season Part 6: Long-Term Trends and Historical Context